
matplotlib
1.plot()函数
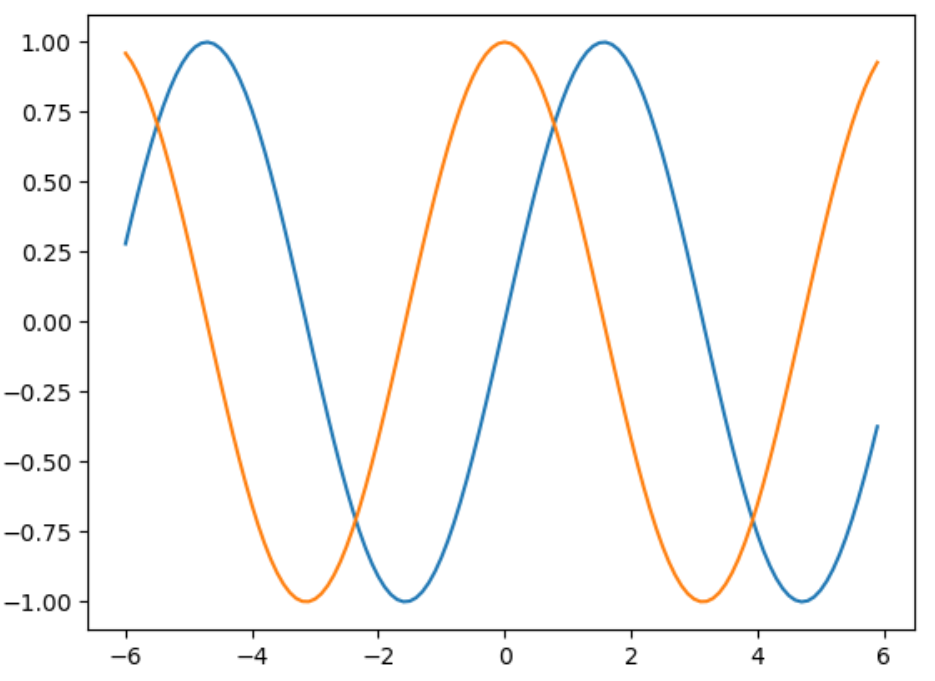
plot()函数会根据列表中的数据尝试绘制出有意义的图形
参数: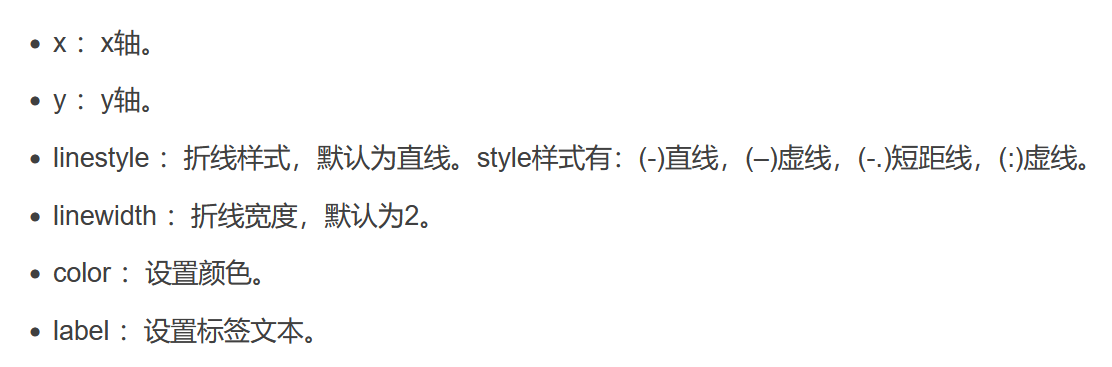
1 | x = np.arange(-6,6,0.1) |
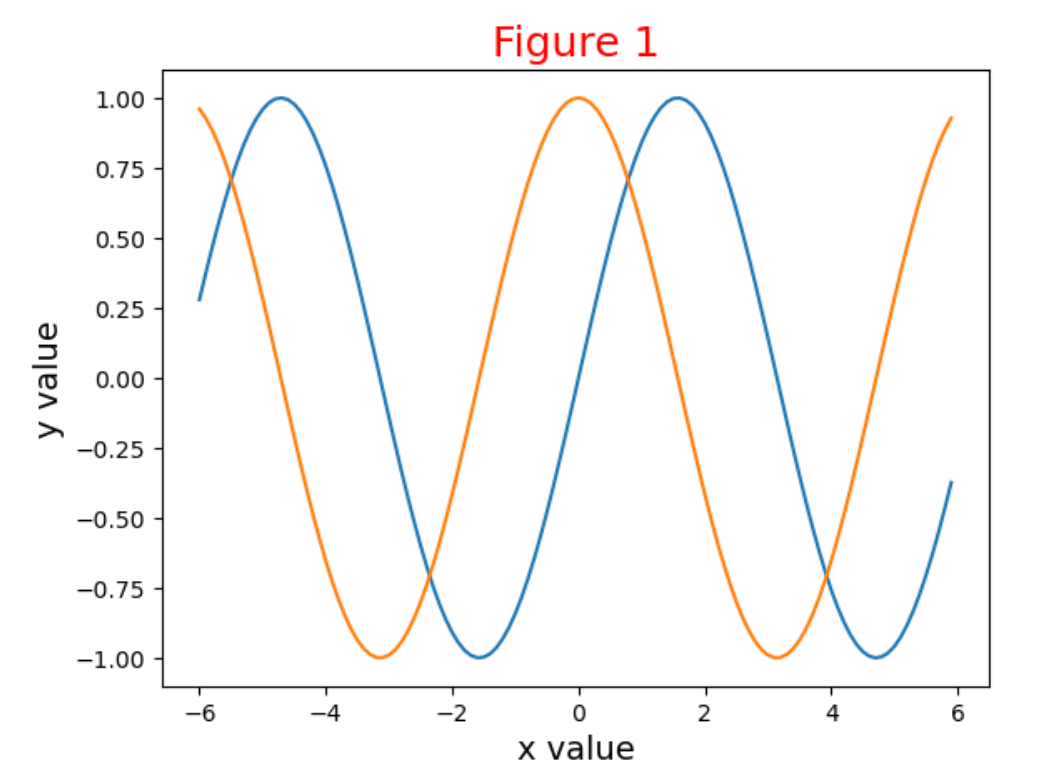
plt的title()方法:添加图标标题
xlabel()、ylabel()方法:为每条轴设置标题、大小等参数
tick_params()方法:指定刻度标记的大小
1 | x = np.arange(-6,6,0.1)#起点:-6,终点:6,步长:0.1 |
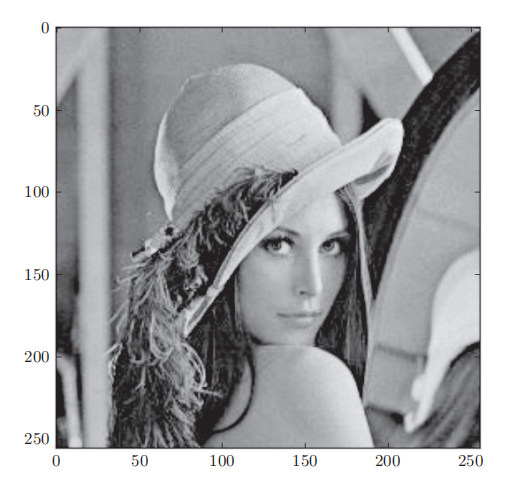
2.图像的显示和读取
1 | img = plt.imread('lena.png') |
本博客所有文章除特别声明外,均采用 CC BY-NC-SA 4.0 许可协议。转载请注明来自 丹青两幻!
相关推荐


评论